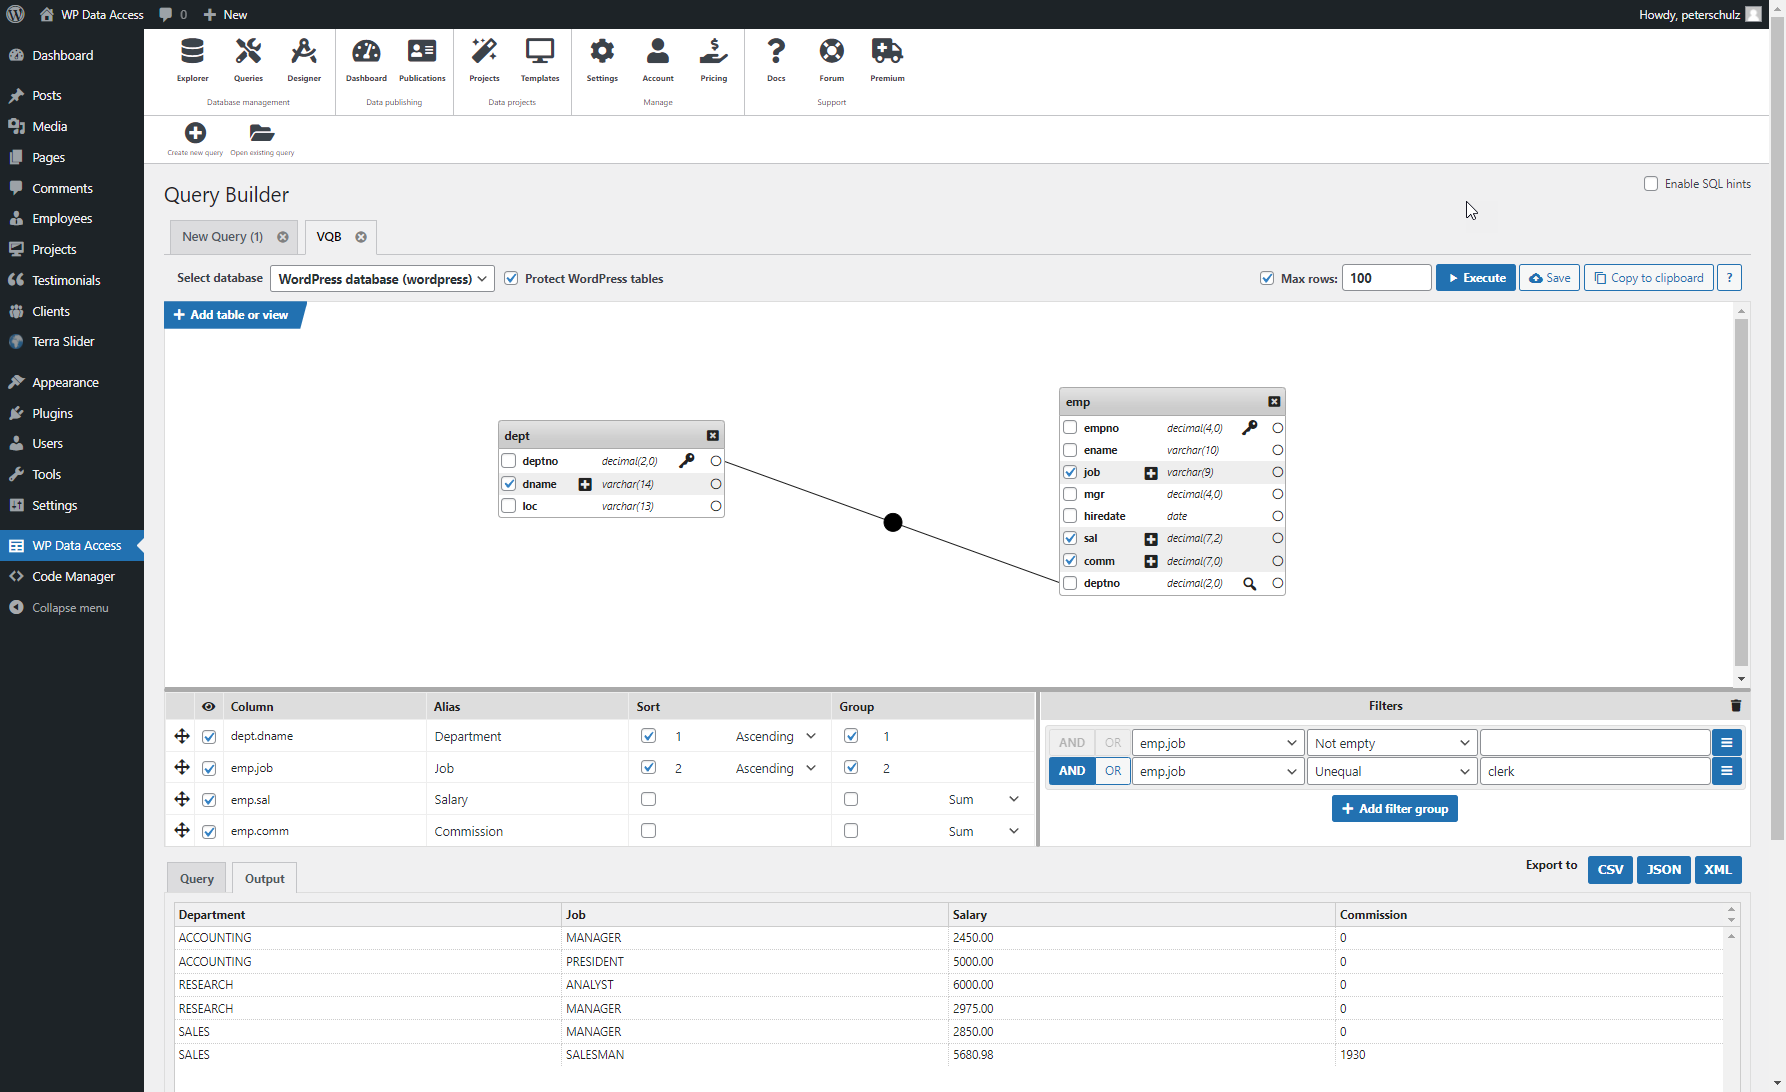
The Visual Query Builder is a premium feature that helps plugin users with no or little SQL knowledge to write SQL queries using an intuitive graphical user interface. Click the button “Visual Query Builder” to start the graphical user interface.
The new Query Builder does not yet include the Visual Query Builder. If you would like to continue using the Visual Query Builder, please switch to the old Query Builder.
Select your database, tables, views, and columns to write your SQL query.
Writing a simple visual SQL query #
- Click the Visual Query Builder button to start
- Click the Add table or view button
- Select a table or view
- Click the Execute button to show all rows of the selected table
Selecting columns #
- Click on the columns you want to add to your selection
- Use the plus icon behind the column name to add a column multiple times (needed for multiple calculations on a column)
- Drag and drop to reorder selected columns
- Disable the visibility checkbox to hide a column value
- Enable sorting to use a column value to order your output
- Enable grouping to group your data
Adding filters #
- Add a filter group first
- Add at least one filter condition to a filter group
- Filtergroups may contain other filter groups allowing nested AND and OR conditions
Relationships #
- Click the circle icon behind a column to select the source column
- Click the circle icon behind another column to select the destination column
- This will result in an inner join
- Click the relationship circle icon the change the relationship settings


I’m familiar with MSAccess.
If the Query-output can be used to produce a table from it, it could be easily used to be published in the proven manner.
Creating data tables from custom queries is explained here:
https://wpdataaccess.com/docs/data-tables-advanced-features/custom-queries/