Demos

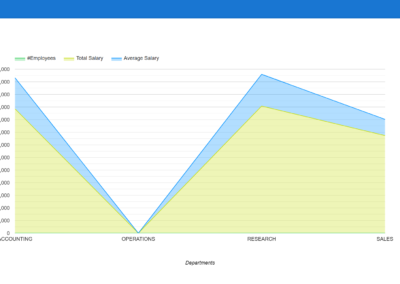
Demo – Salary Per Department
Initially displays a stacked area chart. Use the settings icon to change the chart type.
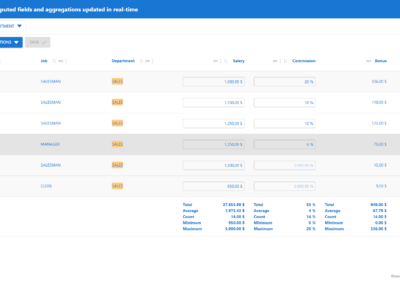
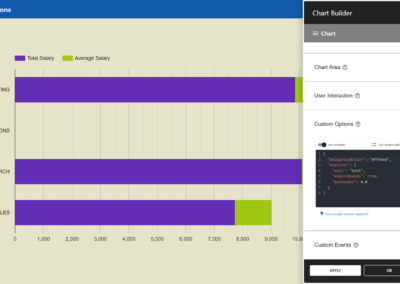
Demo – Interactive Aggregations
Features Excel-like field entry with real-time calculations and aggregations.
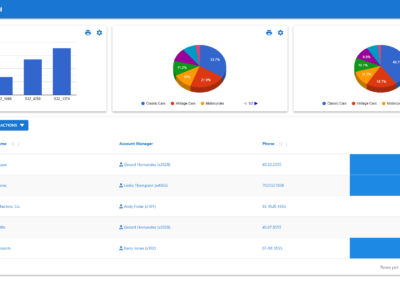
Demo – Dashboard With Table & Charts
Dashboard presenting customer data, stock, orders, and revenues.
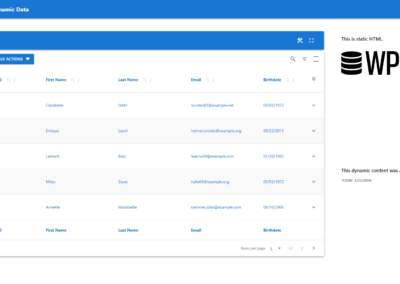
Demo – Static and Dynamic Content
A dashboard combining static and dynamic data with programmatic content.
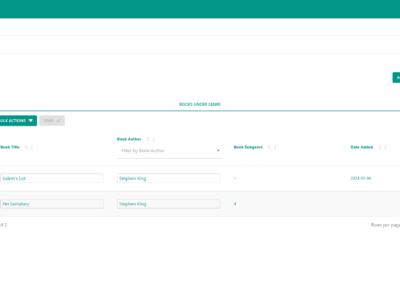
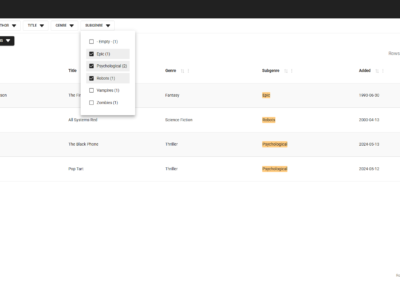
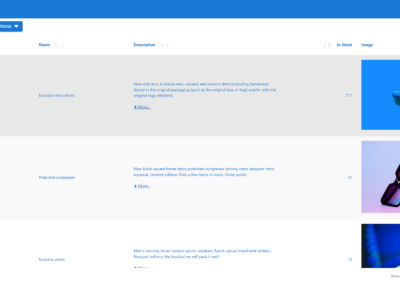
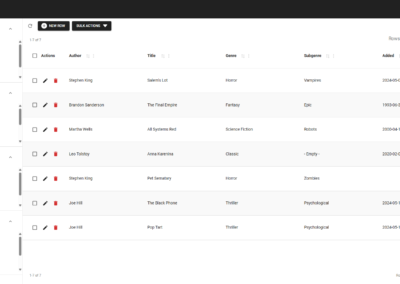
Demo – Advanced Detail Table
Groups books by genre using column filters for the detail table, with Excel-like editing.
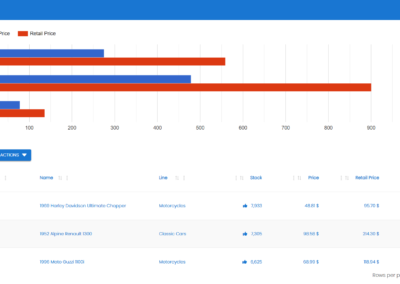
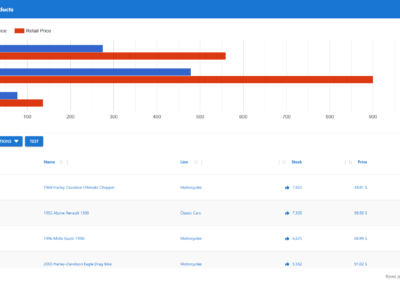
Demo – Table with Chart and BUY Button
Product table from the Classic Model app with a chart and a BUY button.
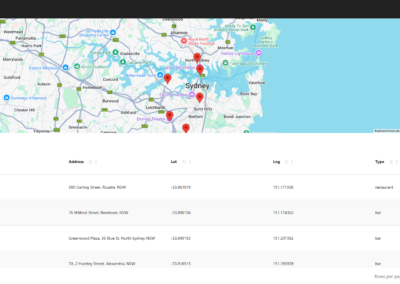
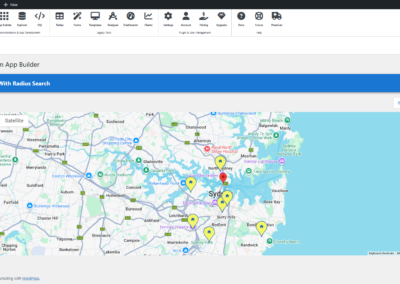
Demo – Location Data With Map
A data table with an embedded map based on location data from the markers table.
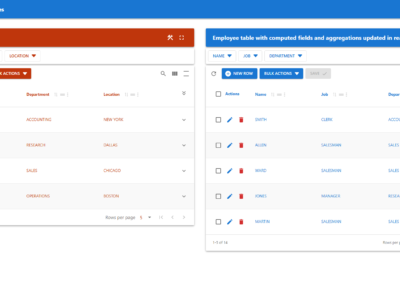
Demo – Dashboard With Multiple Tables
The dashboard and widgets can be displayed in full‑screen mode.
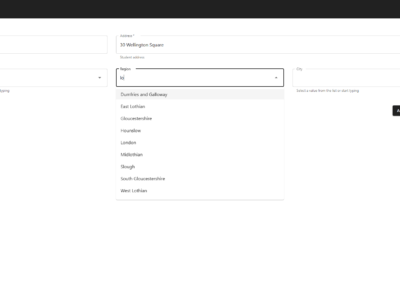
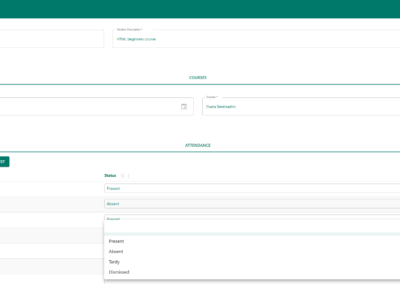
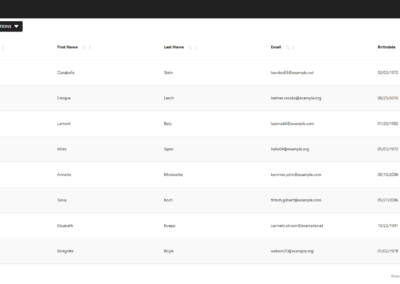
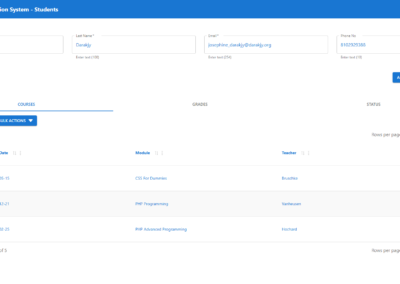
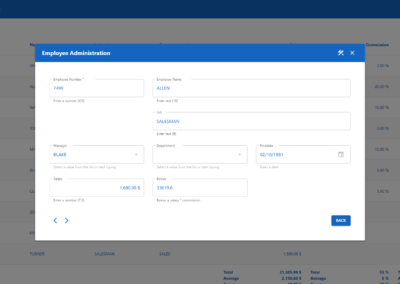
Demo – Advanced Custom Form
A complex student attendance form with server-side pre‑fill and inline updates.
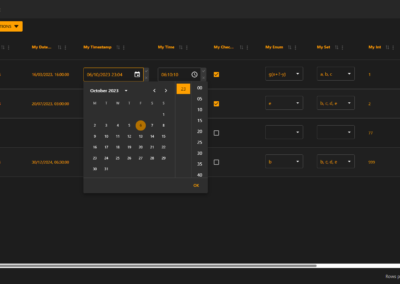
Demo – Excel-like Editing – Dark Mode
Supports Excel-like editing for all available database column types.
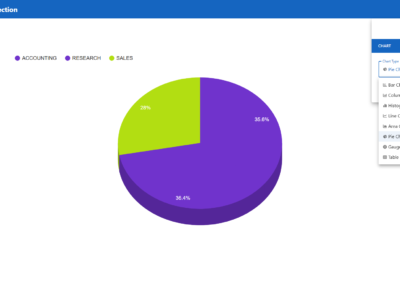
Demo – Interactive Chart Selection
Initially displays a 3D pie chart. Use the settings icon to change the chart type.
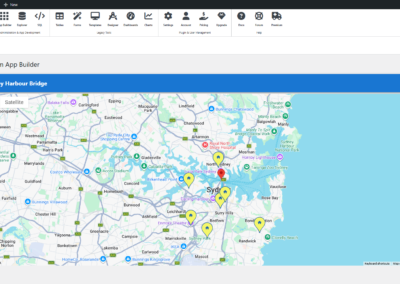
Demo – Advanced Chart Options
A chart using advanced custom options to modify Google Maps default settings.